However, using color as a temperature probe gives only a crude measurement of the star's temperature. Astronomers use another method of determining the temperature more accurately. It uses the strength of different absorption lines in a star's spectrum. Once astronomers developed this method, they began to look for correlations of temperature with other quantities such as mass, size, and luminosity in the hope that the underlying physical principles of stars could be understood. But are the stars you easily see from Earth typical of other stars in other parts of the universe? You will see how that important question can be answered.
Measuring the strength of the hydrogen absorption lines is usually the first step for determining a star's temperature. If the star is too hot or too cold, the hydrogen lines will be weak. To produce strong, dark hydrogen lines, the star's temperature must be within a certain range. To produce a hydrogen absorption line in the visible (optical) band of the electromagnetic spectrum, the atom's electron must be in the second energy level when it absorbs a photon.
If the hydrogen atoms are heated to high temperatures, the atomic collisions can ionize the hydrogen atoms. If there are no electrons bound to the nuclei, there are no hydrogen absorption lines. If the star's temperature is too low, then there are few electrons in the second energy level. Most of the electrons are in the ground state because there are not that many atomic collisions.
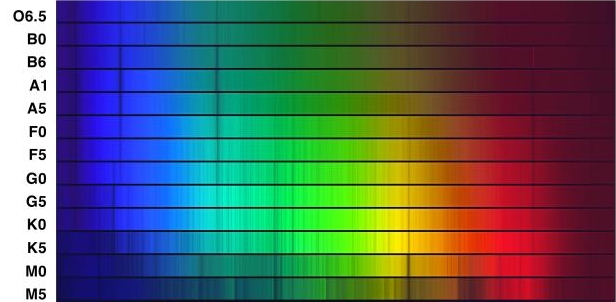
Hydrogen lines will be strong for temperatures = 4,000 to 12,000 K. Helium atoms hang onto their electrons more strongly and, therefore, require higher temperatures of 15,000 to 30,000 K to produce absorption lines in the visible band. Calcium atoms have a looser hold on their electrons so calcium lines are strong for cooler temperatures of 3000 to 6000 K. The strengths of each element's absorption lines are sensitive to the temperature. A given strength of an element's lines will give you either two possible temperatures for the star or a range of possible temperatures. But using two or more element's line strengths together narrows the possible temperature range. Cross-referencing each elements' line strengths gives an accurate temperature with an uncertainty of only 20 to 50 K. This technique is the most accurate way to measure the temperature of a star.
A star's temperature found from the continuous spectrum is not as accurate. One reason for this is that some stars have the peaks of their continuous spectrum outside of the visible band so you cannot use Wien's law (see the Wien's Law section) to determine the temperature. Also, stars are not perfect thermal radiators, so the continuum spectrum (Wien's law) gives only a rough temperature (within a few hundred Kelvin). The spectral lines seen for different types of stars are summarized in the Main Sequence Star Properties table below.
After some rearranging and merging of some classes, the class sequence is now OBAFGKM when ordered by temperature. The O-type stars are the hottest stars and the M-type stars are the coolest. Each class is subdivided into 10 intervals, e.g., G2 or F5, with 0 hotter than 1, 1 hotter than 2, etc. About 90% of the stars are called main sequence stars. The other 10% are either red giants, supergiants, white dwarfs, proto-stars, neutron stars, or black holes. The characteristics of these types of stars will be explored in the following chapters. The table below gives some basic characteristics of the different spectral classes of main sequence stars. Notice the trends in the table: as the temperature of the main sequence star increases, the mass and size increase. Also, because of the relation between luminosity and the size and temperature of a star, hotter main sequence stars are more luminous than cooler main sequence stars. However, there are limits to how hot a star will be, or how massive and large it can be. Understanding why the constraints exist is the key to understanding how stars work.
| Color | Class | solar masses | solar diameters | Temperature | Prominent Lines |
|---|---|---|---|---|---|
| bluest | O | 20 - 100 | 12 - 25 | 40,000 | ionized helium |
| bluish | B | 4 - 20 | 4 - 12 | 18,000 | neutral helium, neutral hydrogen |
| blue-white | A | 2 - 4 | 1.5 - 4 | 10,000 | neutral hydrogen |
| white | F | 1.05 - 2 | 1.1 - 1.5 | 7,000 | neutral hydrogen, ionized calcium |
| yellow-white | G | 0.8 - 1.05 | 0.85 - 1.1 | 5,500 | neutral hydrogen, strongest ionized calcium |
| orange | K | 0.5 - 0.8 | 0.6 - 0.85 | 4,000 | neutral metals (calcium, iron), ionized calcium |
| red | M | 0.08 - 0.5 | 0.1 - 0.6 | 3,000 | molecules and neutral metals |
Red giants can get up to about 50 times the size of the Sun. Supergiants are between 20 times the size of the Sun for the BO supergiants and 1000 times the size of the Sun for the M0 supergiants. Despite the tremendous size of some stars, even the largest supergiant is only 1/7000 light years across. Since stars are several light years from each other, they do not collide with each other (even the fat ones!).
Before this discovery astronomers thought that it was just as easy for nature to make a hot dim star as a hot luminous star or a cool luminous one or whatever other combination you want. But nature prefers to make particular kinds of stars. Understanding why enables you to determine the rules nature follows. A correlation between mass and luminosity is also seen for main sequence stars: Luminosity = Mass3.5 in solar units. The hot, luminous O-type stars are more massive than the cool, dim M-type stars. The mass-luminosity relationship tells about the structure of stars and how they produce their energy. The cause of the mass-luminosity relation will be explored further in the next chapter.
The other ten percent of the stars in the H-R diagram do not follow the mass-luminosity relationship. The giant and supergiant stars are in the upper right of the diagram. These stars must be large in diameter because they are very luminous even though they are cool. They have a huge surface area over which to radiate their energy. The white dwarfs are at the opposite end in the lower left of the diagram. They must be very small in diameter (only about the diameter of the Earth) because even though they are hot, they are intrinsically dim. They have a small surface area and so the sum of the total radiated energy is small.
The H-R diagram is also called a color-magnitude diagram because the absolute magnitude is usually plotted vs. the color. The H-R diagram below is for all stars visible to the naked eye (down to apparent magnitude = +5) plus all stars within 25 parsecs. Luminous stars are easier to observe because they can be seen from great distances away but they are rarer in the galaxy. They tend to reside in the top half of the H-R diagram. Faint stars are harder to see but are more common in the galaxy. They tend to reside in the bottom half of the H-R diagram.
How do you do that?A G2 star appears 25 times dimmer than it would if it was at the standard distance of 10 parsecs used for the absolute magnitude. The G2 star is at a distance of = 10 × Sqrt[1/(1/25)] = 10 × Sqrt[25/1] = 50 parsecs from us. |
Distances to red giant and supergiant stars are found in a similar way but you need to investigate their spectra more closely to see if they are the very large stars you think they are. Their position in the calibrated H-R diagram is found and their apparent brightness gives you the distance. Also, this process can be used to find the distance of an entire cluster. The entire color-magnitude diagram for the cluster is compared with a calibration cluster's color-magnitude diagram. The calibration cluster is a known distance away. Some adjustments for the cluster's age and composition differences between the stars in the cluster and the calibration cluster must be made. Such fine-tuning adjustments are called "main-sequence fitting".
Another way to compare them is to plot the proportions of the spectral types for each group. As shown in the figure below, most of the apparently bright stars are the hot and luminous A and B-type stars. The sample includes a few of the very hot O-type stars. All but one of the K-type stars in the bright star sample are giants or supergiant stars. All of the M-type stars are giants or supergiants.
The graph for the near star sample looks very different: the majority of stars are the cool and faint K and M-type stars. Only one star in the entire sample is a giant star. The rest are main sequence stars.
Which of these samples is more representative of the entire population of stars in our galaxy? A representative sample includes all parts of the population of the objects your are investigating in their proper proportions. The relative proportion of common things will be greater than the relative proportions of rare things. In fact, the uncommon things may not be found in a small representative sample because they are so rare!
A poorly selected sample that is unrepresentative of the larger set can lead to biased results. Such biases can be found in any sample of objects or people. Public officials and politicians who base their decisions on what the polls say people believe or think about different issues, are usually working with biased samples of opinions. The pollsters will interview between 1000 to 2000 people across the nation and from that set, they get an idea of what the entire nation of several hundred million people believe. They get accurate results only if they have a sample of people that properly represents the entire population. It is extremely difficult (if not impossible) to get a representative sample for political polls. The situation for astronomy is easier and standard statistical methods can be used to find a representative sample of stars.
In our example of the types of stars, the bright star sample is very biased. The average distance between each star in the bright star sample is about 20 times greater than the average distance between each star in the near star sample. This gives us a rough idea of how spread out the luminous stars and faint stars---the luminous stars are much more spread out than the cool faint stars. Therefore, in a given volume of space, there will be many more cool faint stars than luminous stars. The faint stars cannot be seen from the great distances the luminous stars are seen, so a sample based on the apparent brightness biases against the very numerous faint stars.