
November 2014 news: Here is my article with my conclusion on the cause of the Allais Effect:
"The Lunar Wake as cause of the Allais Effect"
(this section added on June 30, 2006 - last updated on July 1 2006)
made by Antonio Iovane at the occurrence of the August 11 1999 solar eclipse, in the context of the worldwide experiment coordinated by NASA (lead scientist: David Noever) to test the Allais Effect (anomalous precession of a swinging pendulum) see http://science.nasa.gov/newhome/headlines/ast12oct99_1.htm ).
Basic information on the backgrould of this work may be found on Wikipedia at the entry "Allais effect", that is here.
A very interesting book on the controversial subject matter of anomalies during eclipses in now available (June 2011). It pinpoints the state of the art, as of today, of the theoretical and experimental work in this field. The book, wisely and judiciously edited by Prof. Hector A. Munera, includes contributions by more than 30 authors from 4 continents. The table of contents is here: http://redshift.vif.com/BookBlurbs/Allais-Gravitation.htm or here .
The 480 pages book is published by Apeiron, Montreal, and the title is "Should the Laws of Gravitation be Reconsidered? The Scientific Legacy of Maurice Allais", Hector Munera editor. It includes my own contribution too, which is the most complete description now available of my stationary pendulum experiments (synchronization with gravimeter data recorded in Trieste, tilts of the vertical), much more than what you would find in this website. The title of my paper is "Simultaneous Occurrence of Periodic Eclipse Anomalies at Distant Sites". The book is available at Amazon.
Here is a summary of the experiment.
Here is my scientific correspondence with NASA.
Here is a brief comment by David Noever (read point 5 in the document)
Here is a comparison of the disturbances of my stationary pendulum with the trace of the University of Trieste gravimeter.
Here are more notes on my 1999 test.
Here are more info, links and references on presumed gravitational anomalies during solar eclipses and related work.
This section is under review, and I hope to add more material.
Below are some old links that I would keep alive. They relate to other experimental work (most not dealing with the 1999 eclipse), including other stationary pendulum tests as well. They are not commented, because they served mainly as a repository of graphs and pictures I used in old discussions.
Movie on the Aug 11 1999 eclipse (2.8M, added in Jul 12, 2005) click
HERE
XLS file and curves of noise in temperature (276 K, added in Jun 9, 2005) click
HERE
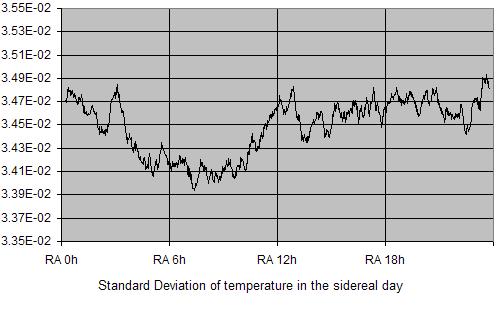
Unexpected pattern in sidereal variance (43 K, added in May 13 2005) click
HERE
For the std dev of temperature in the sidereal day (30 K, added in May 5 2005) click
HERE
For the graphs on sideral temperature (96 K) click
HERE
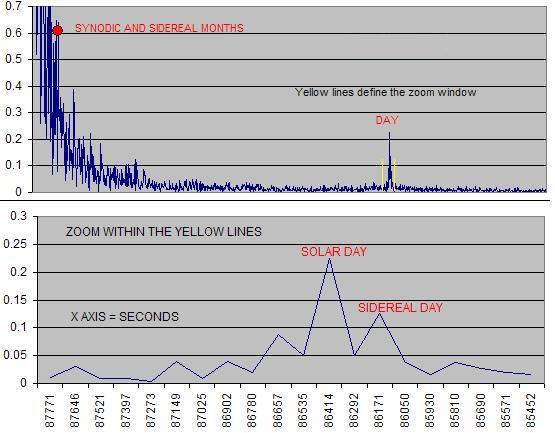
For the FFT spectral analysis (46 K) click
HERE
For the temperature graph in the synodic month (30 K) click
HERE
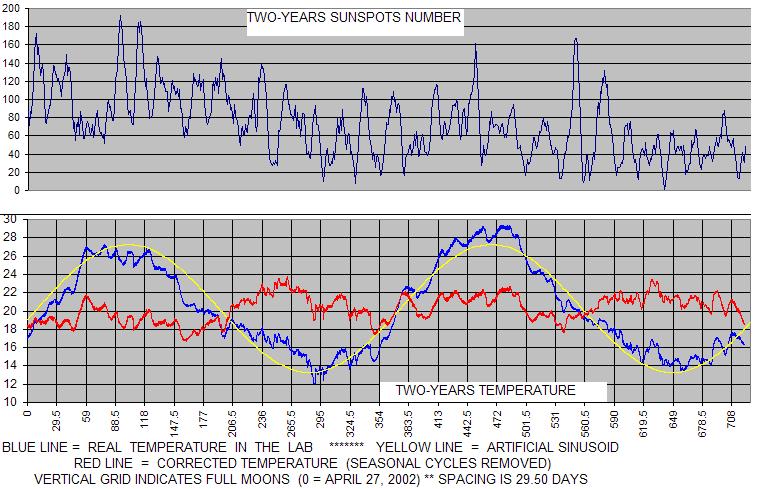
For the temperature against sunspots graphs (100 K) click
HERE
For the eclipse vs non-eclipse epochs synodic temperature curves (50 K) click
HERE
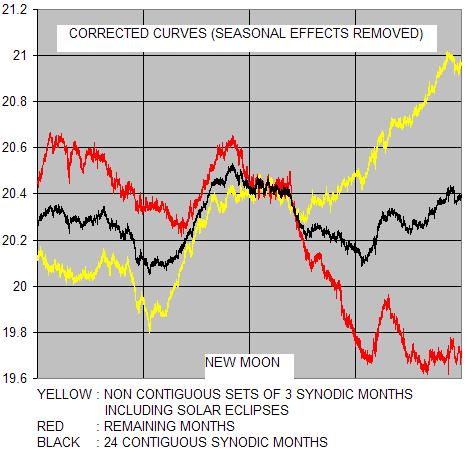
For the corrected synodic-month curves (43 K) click
HERE
For the 2003 May 31 eclipse movie (1.8 MegaBytes) click
HERE
Tilt of the vertical - May 31 2003 eclipse (70 K) click
HERE
For the gram of temperature in the lab (17 K) click
HERE
This is my stationary pendulum #2, not the one used in 1999.

Actual size of the bright dot ..................50 micron
(diameter)
Size of the dot in a 14" screen ..............55 mm
(diameter)
Relative size of the calibrated grid ........200 x 160 micron;
size of a square ...........20 x 20 micron.
Size of the grid in a 14" screen .............220 x 176 mm;
size of a square ...........22 x 22 mm (about 1")
For a 2 meters length of the wire, the dot is 25 microrad wide, a
square is 10 microrad and the grid is 100 x 80 microrad.
The animated graph has been moved
HERE
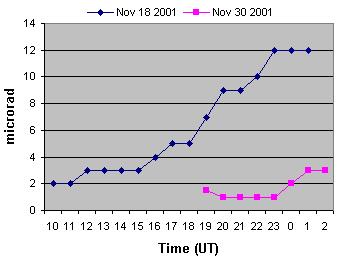
The Nov 2001 graph has been moved
HERE
You are the visitor no.
===