This page added on Nov 3 2008. Last updated March 26 2011. Update in progress........ my home page
The purpose of this document is to comment on gravimeter data recorded in Trieste during the August 11 1999 solar eclipse, and on the correlation with disturbances on a stationary pendulum recorded by me 500 Km apart, near Naples (Marigliano).
The gravimeter trace is courtesy of University of Trieste, Italy. Courtesy to me, they never published these data because the gravimeter showed a drift. Having found a strong correlation between the gravimeter trace and the disturbances observed on the stationary pendulum (red segments), I thought to put these data into the public domain.
This publication is not authored by University of Trieste. Their position relative to their trace is here.
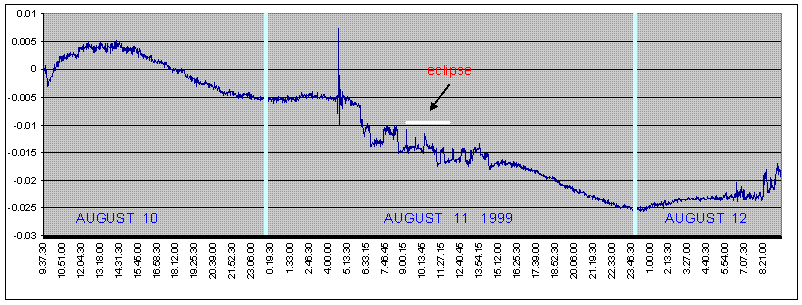
The following is a synoptic view of all the data.
Graph1: blue line = gravimeter trace - red segments = pendulum disturbances - S = eclipse start, M = max eclipse, E = eclipse end
Equipnemt used in Trieste:
LaCoste-Romberg mod. D gravimeter with ZLS feedback.
Timetable
(UTC):
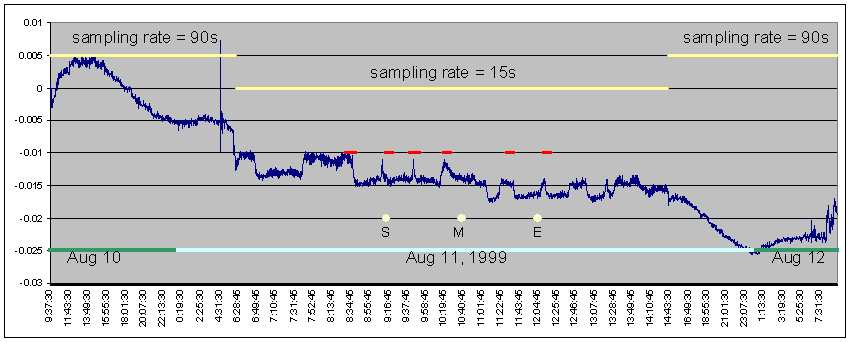
from 09:36 (10.08.1999) to 06:19 (11.08.1999)
sampling every 90 secs. (830 events recorded)
from 06:26 (11.08.1999) to 14:30 (11.08.1999)
sampling every
15
secs.
(1937
events recorded)
from 14:34 (11.08.1999) to 09:30 (12.08.1999) sampling every 90 secs.
(758 events recorded).
My equipment in Marigliano:
Stationary pendulum, meant to be at rest. Length of the wire = 5.5 m, bob = brass cylinder 4.7 Kg.
Recording means: video camera with macro lens, facing upwards to the bottom of the bob. Remote VCR and monitor More details will be uploaded here.
Around eclipse time it showed spontaneous oscillations, in the order of 10e-5 radian, much more than in any other recorded control period.
Gravimeter data.
Graph1 is distorted, due to faster sampling rate during the central period, where it is "stretched". For our purposes this is not important. Anyway here is a undistorted graph (graph3), with right proportions, obtained miming a constant sampling rate of 90 sec, that is taking 1 data point out of every 6 during the central period.
We will make reference to graph1.
The curve is corrected for tides. Y axis is milliGal.
There are some known extraneous (man made) disturbances, they are at:
-start of the curve: the gravimeter was just turned on
-end of the curve: people went to the gravimeter to end measurements
-change of sampling rate: from 90 sec to 15 sec
-change of sampling rate: from 15 sec to 90 sec
It appears that other disturbances are present only around the eclipse, and this is better seen on graph3 below.
What makes these data even more believable is the strong correlation with my stationary pendulum data.
Stationary pendulum data.
What is considered is the azimuth of the major axis of spontaneous oscillation. What is plotted in red on the graph are the periods of larger variations of its azimuth.
Important note: this correlation was blind, in that the red segments are plotted in strict accordance with the notes written one month before receiving Trieste data. Reference being made to NASA message #10 of Aug 22 1999 ( http://xoomer.alice.it/iovane/mails.htm#s10 ) what is plotted is the content of the paragraph "From the notebook", and no more. That's to mean that I've not searched the tapes to get this correlation after receiving Trieste data. Indeed I've also searched the tapes later, and found other correlations, but I wanted not to plot them not to defile the blind correlation. Some correlations found later have instead been plotted on graph2.
Notes on graph2 below.
Graph2 is a zoom into the period of disturbances of the Trieste trace. It shows a strange feature of the variations, that is quite a constant spacing of 34.5 minutes. The black vertical grid has been calibrated to fit peaks A B C D. It doesn't fit peaks E F G H, which seem to be also equally spaced (yellow grid) but "out of phase". This would suggest a center of symmetry at point I.
Recently I've reviewed the tapes (converted to DVD) several times, and noticed that within the period covered by graph2 the bob "wobbled" for some seconds several times. A "wobble" can be seen here. The time of these wobbles is marked by red triangles on the graph. Most of them are in correlation with peaks of disturbances in Trieste. No wobbles after point I.
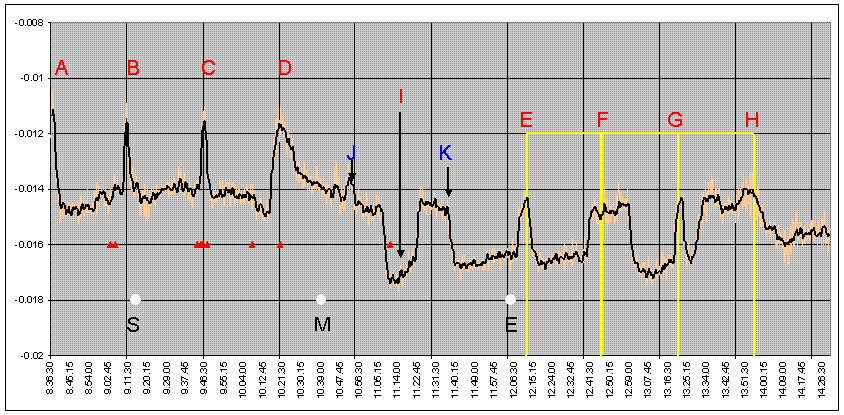
Graph2: zoom into the disturbances. Note the strange constant spacing, which has a counterpart in my stationary pendulum as shown on graph1.
The red triangkes do mark the time of "wobbles".
Graph3: here the proportions of the curve are correct. It is seen more clearly that disturbances were present only around eclipse time.
NOTES:
What University of Trieste said about their gravimeter trace is:
The choice of the place where to place the gravimeter has not been very happy: there is background noise (traffic and other human activities) which overlaps the signal to study: unfortunately we have been involved in these measurements a few days (3) before the eclipse, and this prevented us from organizing a more appropriate site: personally I am rather disappointed with the results!
What is observed is the instrumental drift (about 0.0007 mGal/h) with other events overlapped.
In agreement with Prof. (omitted) we are sending you the data we have recorded, so that you could quietly meditate on the objective data. Plotting col. 11 you will see immediately the observed variations.
Have a good work and my greetings.
P.S. Please let us know the results....thanks