PeakMeterCtrl
The main PeakMeterCtrl implementation.
 Methods Summary
| __init__ | Default class constructor. |
| DoGetBestSize | Gets the size which best suits the window: for a control, it would be the |
| DoTimerProcessing | PeakMeterCtrl animation, does the wx.EVT_TIMER processing. |
| DrawHorzBand | Draws horizontal bands. |
| DrawVertBand | Draws vertical bands. |
| GetAGWWindowStyleFlag | Returns the PeakMeterCtrl window style. |
| GetFalloffEffect | Returns the falloff effect flag. |
| GetRangeValue | Get range value of PeakMeterCtrl. |
| InitData | Initializes the control. |
| IsGridVisible | Returns if gridlines are visible. |
| IsStarted | Check if animation is active. |
| OnEraseBackground | Handles the wx.EVT_ERASE_BACKGROUND event for PeakMeterCtrl. |
| OnPaint | Handles the wx.EVT_PAINT event for PeakMeterCtrl. |
| OnSize | Handles the wx.EVT_SIZE event for PeakMeterCtrl. |
| OnTimer | Handles the wx.EVT_TIMER event for PeakMeterCtrl. |
| ResetControl | Resets the PeakMeterCtrl. |
| SetAGWWindowStyleFlag | Sets the PeakMeterCtrl window style flags. |
| SetBackgroundColour | Changes the background colour of PeakMeterCtrl. |
| SetBandsColour | Set bands colour for PeakMeterCtrl. |
| SetData | Change data value. |
| SetFalloffDelay | Set peak value speed before falling off. |
| SetFalloffEffect | Set falloff effect flag. |
| SetMeterBands | Set number of vertical or horizontal bands to display. |
| SetRangeValue | Sets the ranges for low, medium and high bands. |
| ShowGrid | Request to have gridlines visible or not. |
| Start | Start the timer and animation effect. |
| Stop | Stop the timer and animation effect. |
 Class API
The main PeakMeterCtrl implementation.
Default class constructor.
| Parameters: |
|
|---|
Gets the size which best suits the window: for a control, it would be the minimal size which doesn’t truncate the control, for a panel - the same size as it would have after a call to Fit().
Note
Overridden from wx.PyControl.
PeakMeterCtrl animation, does the wx.EVT_TIMER processing.
Draws horizontal bands.
| Parameters: |
|
|---|
Todo
Implement falloff effect for horizontal bands.
Draws vertical bands.
| Parameters: |
|
|---|
Returns the PeakMeterCtrl window style.
See also
SetAGWWindowStyleFlag for a list of possible window style flags.
Get range value of PeakMeterCtrl.
Handles the wx.EVT_ERASE_BACKGROUND event for PeakMeterCtrl.
| Parameters: | event – a wx.EraseEvent event to be processed. |
|---|
Note
This method is intentionally empty to reduce flicker.
Handles the wx.EVT_PAINT event for PeakMeterCtrl.
| Parameters: | event – a wx.PaintEvent event to be processed. |
|---|
Handles the wx.EVT_SIZE event for PeakMeterCtrl.
| Parameters: | event – a wx.SizeEvent event to be processed. |
|---|
Handles the wx.EVT_TIMER event for PeakMeterCtrl.
| Parameters: | event – a wx.TimerEvent event to be processed. |
|---|
Resets the PeakMeterCtrl.
Sets the PeakMeterCtrl window style flags.
| Parameters: | agwStyle – the AGW-specific window style. This can be a combination of the
following bits:
|
|---|
Changes the background colour of PeakMeterCtrl.
| Parameters: | colourBgnd – the colour to be used as the background colour, pass wx.NullColour to reset to the default colour. |
|---|
Note
The background colour is usually painted by the default wx.EraseEvent event handler function under Windows and automatically under GTK.
Note
Setting the background colour does not cause an immediate refresh, so you may wish to call wx.Window.ClearBackground or wx.Window.Refresh after calling this function.
Note
Overridden from wx.PyControl.
Set bands colour for PeakMeterCtrl.
| Parameters: |
|---|
Change data value. Use this function to change only a set of values. All bands can be changed or only 1 band, depending on the application.
| Parameters: |
|
|---|
Set peak value speed before falling off.
| Parameters: | speed – the speed at which the falloff happens. |
|---|
Set falloff effect flag.
| Parameters: | falloffEffect – True to enable the falloff effect, False to disable it. |
|---|
Set number of vertical or horizontal bands to display.
| Parameters: |
|
|---|
Note
You can obtain a smooth effect by setting nHorz or nVert to “1”, these cannot be 0.
Sets the ranges for low, medium and high bands.
| Parameters: |
|
|---|
Note
The conditions to be satisfied are:
Min: [0 - nMin[, Med: [nMin - nMed[, Max: [nMed - nMax]
Request to have gridlines visible or not.
| Parameters: | showGrid – True to show grid lines, False otherwise. |
|---|
Start the timer and animation effect.
| Parameters: | delay – the animation effect delay, in milliseconds. |
|---|

 Inheritance Diagram
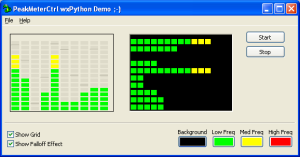
 Control Appearance