plot
plot¶This is a simple light weight plotting module that can be used with Boa or easily integrated into your own wxPython application. The emphasis is on small size and fast plotting for large data sets. It has a reasonable number of features to do line and scatter graphs easily as well as simple bar graphs. It is not as sophisticated or as powerful as SciPy Plt or Chaco. Both of these are great packages but consume huge amounts of computer resources for simple plots. They can be found at http://scipy.com
This file contains two parts; first the re-usable library stuff, then, after a “if __name__==’__main__’” test, a simple frame and a few default plots for examples and testing.
Based on wxPlotCanvas Written by K.Hinsen, R. Srinivasan; Ported to wxPython Harm van der Heijden, feb 1999
Did a lot of work here to speed markers up. Only a factor of 4 improvement though. Lines are much faster than markers, especially filled markers. Stay away from circles and triangles unless you only have a few thousand points.
Times for 25,000 points Line - 0.078 sec Markers Square - 0.22 sec dot - 0.10 circle - 0.87 cross,plus - 0.28 triangle, triangle_down - 0.90
Thanks to Chris Barker for getting this version working on Linux.
 Classes Summary
| PlotCanvas | Subclass of a wx.Panel which holds two scrollbars and the actual |
| PlotGraphics | Container to hold PolyXXX objects and graph labels |
| PlotPrintout | Controls how the plot is made in printing and previewing |
| PolyLine | Class to define line type and style |
| PolyMarker | Class to define marker type and style |
| PolyPoints | Base Class for lines and markers |
| PolySpline | Class to define line type and style |
| TestFrame |


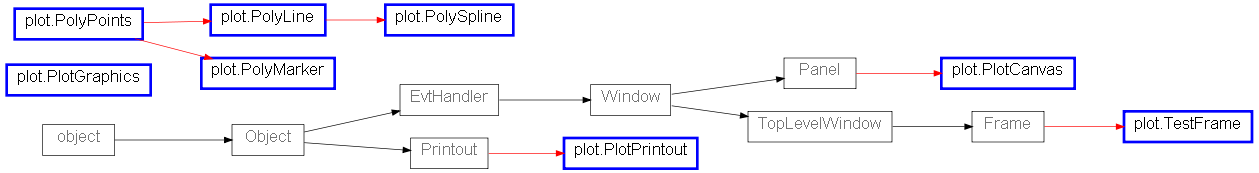
 Inheritance Diagram