The two color or color-color diagram a definition
![]()
![]()
Intrinsic color definition
The observed colors (B-V) and (U-B) must be corrected to evaluate the true intrinsic colors of the stars. All this is needed because the light coming from each star undergoes several absorptions and dissipations during its trip through the intergalactic space and through the earth atmosphere. The total effect is:
S( l ) = Aist( l ) Aatm( l ) Ainst( l )
Where S( l ) = Total spectral transmission curve, Aist( l ) = Interstellar absorption, Aatm( l ) = Earth atmospheric absorption and Ainst( l ) = Signal loss inside the observing instrumental system. So, we must evaluate the ureddened or intrinsic colors (B-V)o and (U-B)o as:
(B-V)o = (B-V) - E(B-V)
(U-B)o = (U-B) - E(U-B)
Intrinsic colors for V, III, and Ia luminosity classes on CCD or TDC diagram
An open cluster color-color or two color diagram (CCD / TCD), is simply a plot of the observed (B-V) vs. (U-B) color indices. Usually this plot is drawn using cluster stars togheter with an unreddened intrinsic color-color relation for main sequence stars such as Schmidt-Kaler, Fitzgerald or Allen. To give an example we can start drawing, in the following two figures, both the Schmidt-Kaler intrinsic colors fig. 1 and Fitzgerald intrinsic colors in fig. 2. Note how (U-B) color become smaller moving upwards in the plot, this because the stars become brigther in the U band than in the B band.
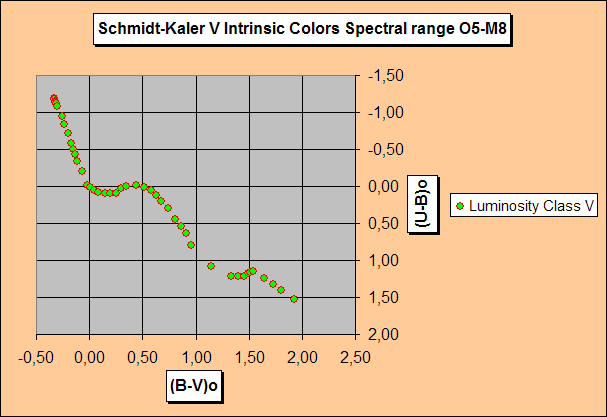
Fig. 1 - Schmidt-Kaler unreddened luminosity class V intrinsic color on Two Color Diagram
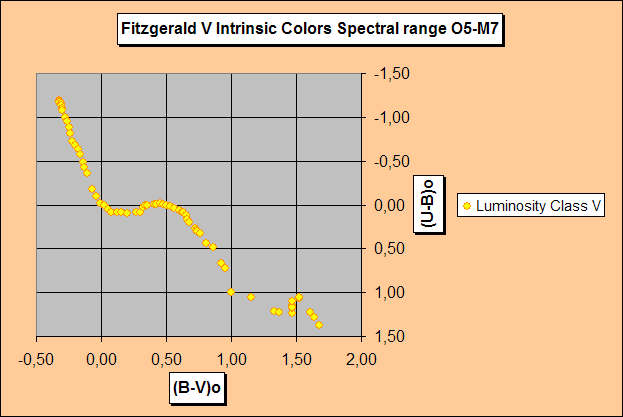
Fig. 2 - Fitzgerald unreddened luminosity class V intrinsic color on Two Color Diagram
From an operative point of view, a two color diagram is useful not only to obtain the cluster reddening, but also as discriminator between members and non members. Besides, the analysis of the shape and the distribution of the luminosity class V stars, can give approximately an idea over cluster age. In the following figure 4, are shown unreddened luminosity classes III and Ia on a two color diagram respectively from: Schmidt-Kaler and Fitzgerald intrinsic colors tabulations.
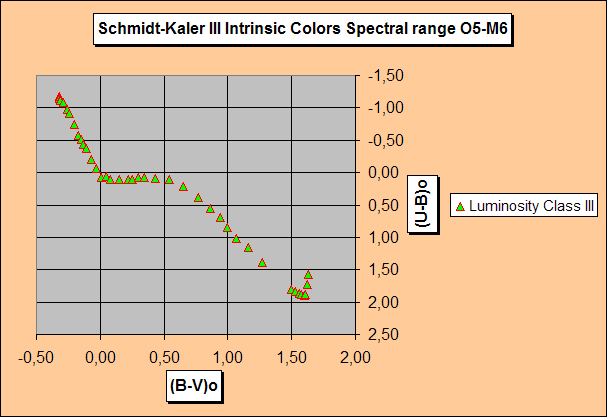
Fig. 3 - Schmidt-Kaler unreddened luminosity class III intrinsic color on Two Color Diagram
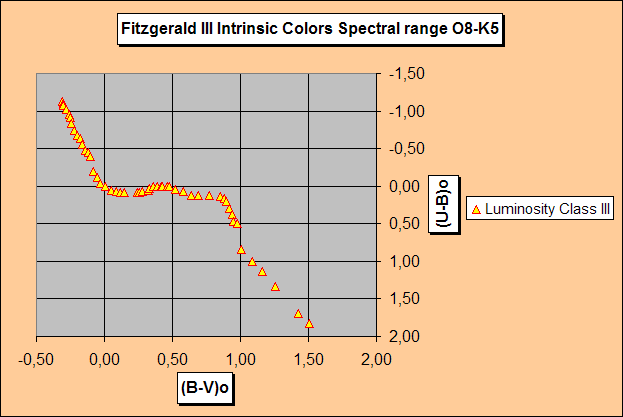
Fig. 4 - Fitzgerald unreddened luminosity class III intrinsic color on Two Color Diagram
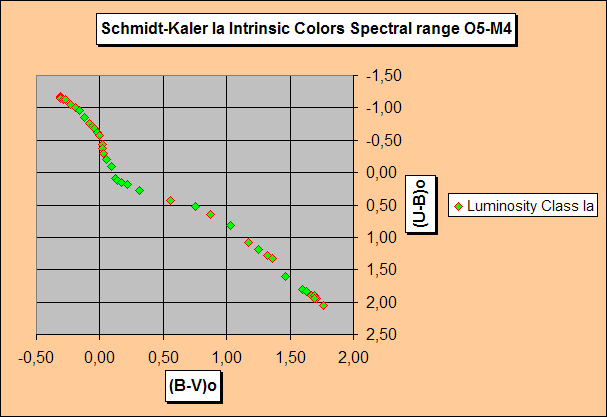
Fig. 5 - Schmidt-Kaler unreddened luminosity class Ia intrinsic color on Two Color Diagram
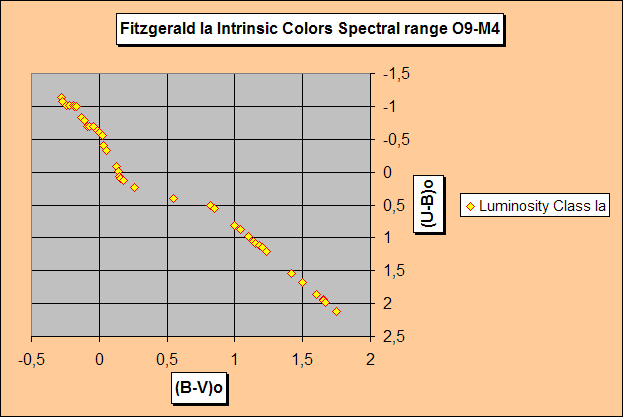
Fig. 6 - Fitzgerald unreddened luminosity class Ia intrinsic color on Two Color Diagram
Luminosity Class V calibration and the Black Body locus on CCD/TCD diagram
Black bodies data are from H. Arp " U-B and B-V colors of black bodies " 1961 Ap.J. 133, 874
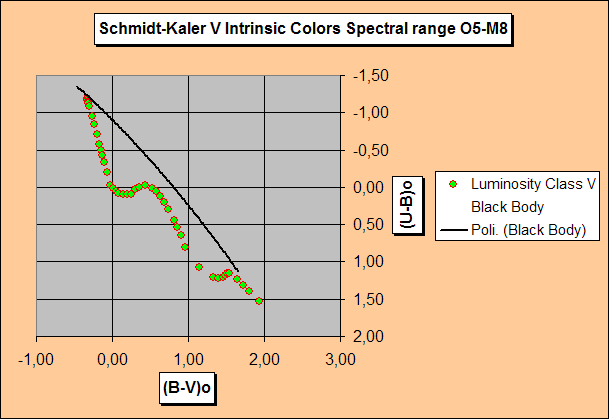
Fig. 7 - Schmidt-Kaler luminosity class V calibration and Black Bodies locus on CCD/TCD diagram.
In the previous figure 7 we see together, the luminosity class V intrinsic color calibration and the locus of several temperatures black bodies. Black bodies follow a nearly linear locus. This locus is represented by a quadratic fit of H. Arp values - black curve. Real stars deviate significantly from a black body of similar temperature and the differences are due to the presence of the absorption lines in the spectra of the stars. Particularly the steep slope of the intrinsic color calibration between: -0,35 < (B-V)o < 0,00 is due to the increase in strengh of the hydrogen absorpion lines, as well as of the Balmer discontinuity, passing from O3 to A0 stars. In this spectral range, in fact, the flux through U filter decrease causing, at the same time, larger values in the (U-B) color index. (equivalent to magnitudes larger --> stars fainter ). After A0 spectral type and particularly in the range containing spectral classes between A0 to A5, the hydrogen lines and the Balmer discontinuty become weaker and (U-B) color decrease. After A5 spectral type, many metal lines and various molecular bands, caused by the stars relatively low surface temperatures, become very strong so (U-B) index become large again. The interesting dipendence of (U-B) color index by metal abundance is related to the amount of absorption due to metal lines in star spectrum, so an abnormal metal abundance can be discriminated by the effects on this color index.
Comparison between a poor reddend open cluster (Pleiades) and intrinsic color shapes on CCD/TCD diagram
Since the Pleiades cluster is situated beyond 100 pc ( 132pc. U. Munari, 139pc J. Southworth) from the Earth, it does not suffer an elevated reddening value ( about E(B-V) = 0,035 ) and can be used to compare a real two color or color-color shape with an empirical calibration such as the Schmidt-Kaler or Fitzgerald. In figure 8, we see the Schmidt-Kaler two color calibration and the Pleiades features superimposed, while in figure 9, we see the Fitzgerald two color calibration and Pleiades features superimposed.
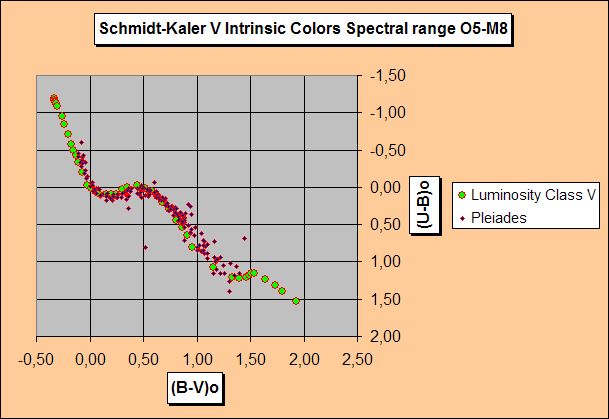
Fig. 8 - Comparison between Schmidt-Kaler luminosity class V calibration and Pleiades shapes on CCD/TCD diagram.
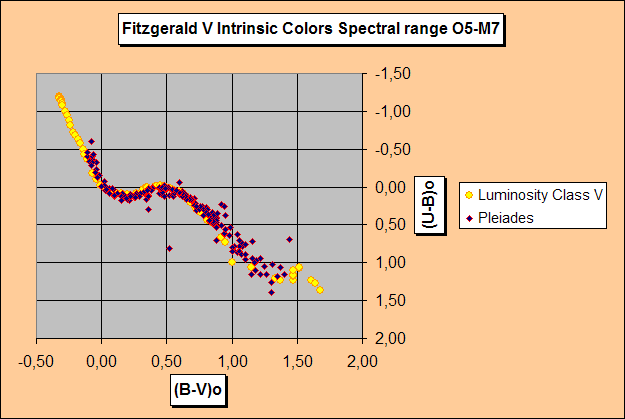
Fig. 9 - Comparison between Fitzgerald luminosity class V calibration and Pleiades shapes on CCD/TCD diagram.
![]()
![]()
© 2006 - Valter Arnò.