Interstellar Reddening and Absorpion
Reddening lines and ratio between total to selective absorption
![]()
![]()
Warning: sometimes, in this page, I used the Italian notation so the commas should always be read as dots.
Is well known that interstellar space between stars is not empty and that, more generally, some part of stars radiation is scattered or absorbed by interstellar particles before it arriving at earth. Interstellar dust non only dims stars, but it makes them redder than their normal colors. A scattering process is problably the true responsible for the reddening through selective diffusion and absorpion of blue light more than red light. This process is very similar to the scattering of the sunlight in our atmosphere, during the sunset. Particularly all stars more distant than 100 parsec, must be considered reddened. This situation clearly contribute to generate a color excess, that is the difference between observeved and intrinsic colors expressed in magnitudes. For instance using (B-V) Jonhson color index, one can define the color exces as:
E(B-V) = (B-V)observed - (B-V)intrinsic.
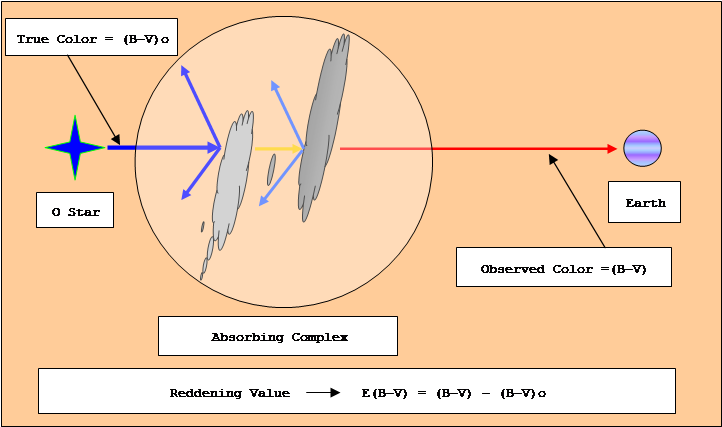
The combined effect of scattering and absorption is called interstellar extincion A and is measured in magnitudes per kiloparsec. Generally extinction depends on the wavelenght of the observation as: A = A(l) as well as on the environment contained in the particular region of the galaxy under observation. Outside galactic the plane extinction it diminishes very raplidly and can be described by the following formula:
A(r,b) = Ao sec b(1-exp(-r sin |b| / b )
Where Ao = extinction constant, b = galactic latitude and b = thickness of extinction layer. However previous formula can not be applied to a single star, because of very large fluctuations in the intersellar medium. So we can affirm that interstellar reddening apperars, when our observation confirm the esistence of stars whose color temperature ( Photometry ), were apparently much lower than the temperatures ( Spectroscopy ), indicated by the degree of ionizazation in their spectra.
Interstellar reddening evidence
The followig figure is based on a Johnson and Morgan catalog of 260 spectroscopically inferred O type stars, whose location is not too far from galactic disk plane. Clearly this chart show reddened O early type star with observed B-V color index typical of red late type stars. Seems therefore evident the action of the galactic disk environment, through the change of early type stars color.
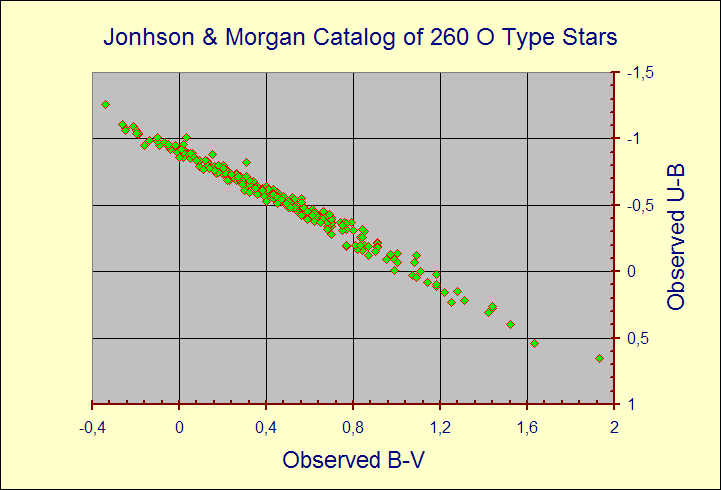
Fig. 1 - Johnson & Morgan O type stars catalog


Notice the increase of the dust between various cluster environments, passing from M67 up to Ngc 6611, while at the same time, the age of the clusters is decreasing passing from M67 to Ngc 6611. Dust environments as those of Ngc 3293 and Ngc 6611 causes always differential extinction over cluster fields.
O type reddening line RL determination using Johnson & Morgan O stars Catalog
Considering the previous fig. 1 we can tray to fit the O stars distribution to obtain the reddening locus RL along which the stars of this spectral class are dispersed by the interstellar extinction.
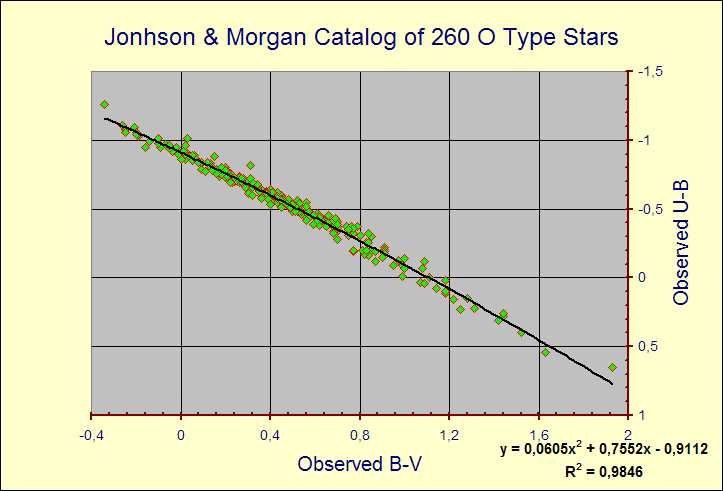
Fig. 2 - Fit of Johnson & Morgan O type stars catalog
Since the degree of correlation is clearly not linear, as can be seen in figure 1 and 2, the expected form for this fit will be: E(U-B) = XE(B-V) + YE(B-V) 2. So, the reddening line locus determined for a similar distribution is:
Y = 0.0605 X 2 + 0.7552 X - 0.9112
Where X and Y must be read respectively: E(B-V) and E(U-B). At the same time the 0.06 and 0.75 numerical values represent respectively the reddening line locus curvature and slope. Actually however, the curvature factor of 0.06 seems quite inappropriate for most star clusters and a 0.02 value for curvature is considered more corrected. Turner D. G. (1989, 1994). We must also specify that while curvature factor Y appears to be constant along galactic plane, the slope varies from one region to another assuming a medium value closer to X = 0,75.
The ratio of total to selective absorption R = E(U-B)/E(B-V)
From an operative point of view, to investigate the ratio R = E(U-B)/E(B-V) directly using the available data, rather then to assume the normal value, is a very important point. The ratio can be evaluated provided we know very accurate spectral types and luminosity classes for a sample of the cluster members. If we know spectral types for a good number of objects in cluster, the ratio R of total to selective visual absorption can be evaluated following Turner (1976). Practically, one uses the Johnson (1965) cluster method, under assumption that all stars within a cluster are at the same distance from us - neglecting thus the depth of the cluster itself, that can be considered tiny compared with its distance from Earth -. Under this conditions the distance modulus V-Mv, where V is the observed visual magnitude on UBV system, should be a constant except for the effects due to variable interstellar absorption whitin cluster volume itself. At this point the value of R can be evaluated knowing both UBV magnitudes and spectral types. From spectral types, infact, we can obtain the absolute visual magnitudes Mv and (B-V)o intrinsic colors, through one standard calibration (Schmidt-Kaler, Allen), evaluating the color excess E(B-V) as:
E(B-V) = (B-V)observed - (B-V)o
Now plotting V-Mv versus E(B-V), the slope of the straight line which best-fit observational data gives the R value. A good value of R is very important, since the ratio of total to selective absorption R = E(U-B)/E(B-V) enters directly in the calculation of the true distance modulus as:
VO MV = V RE(B-V) MV
In the previous equation Vo is the visual magnitude without effects of interstellar absorption and Mv is the absolute magnitude.
The average interstellar extinction curve
The phrase " Interstellar Exctinction " refers to the integrated effects ( sum ) of absorption and scattering. Generally this quantity is obtained comparing observation of reddened and unreddened stars, of the same spectral type and luminosity classes. Using, therefore, samples of identical intrinsic energy distributions. The observed difference are then attribuited to the extinction action.

Fig. 3 - Average interstellar extiction curve
The quantity E(l-V) is referred to extiction in magnitudes between l wavelengh and the UBV system V band. Relation between plotted quantity and the total extinction A at the wavelenght l, is expressed by the following equations:
![]()
![]()
![]()
![]()
© 2006 - Valter Arnò.